
The following updates have been rolled out to all clusters. As usual there’s improvements across various add-ons, ensuring enhanced performance and security. There’s possibly some actions required on your side regarding Grafana, so please read the entire post.
- amazon-eks-ami v20250505
- aws-ebs-csi-driver v1.43.0-eksbuild.1
- aws-efs-csi-driver v2.1.8
- aws-load-balancer-controller v2.13.0
- aws-vpc-cni v1.19.5-eksbuild.1
- cert-manager v1.17.2
- coredns v1.11.4-eksbuild.10
- fluent-bit v4.0.1
- Conditional Processing for Logs. Unfortunately this feature is only available via Fluent-Bit YAML configuration files, which our deployment method does not support yet (using classic configuration).
- ingress-nginx v1.12.2
- karpenter v1.4.0
- kube-proxy v1.32.3-eksbuild.7
- kube-prometheus-stack 72.1.0
- Grafana v11.6.1
- Next to Dashboards, we have enabled ConfigMap provisioning for Grafana Alerts (label:
grafana_alert) and Datasources (label:grafana_datasource). Setup is siimilar to dashboards: you create a ConfigMap in the cluster with the correct label and 1 or more json files as data. However there’s a caveat: live reloading of these configs is not possible due to the our oauth2 based authentication for Grafana. Instead, Grafana needs to be restarted to pick up changes.
- Next to Dashboards, we have enabled ConfigMap provisioning for Grafana Alerts (label:
- Prometheus v3.3.1
- Prometheus Operator v0.82.1
- Grafana v11.6.1
- metrics-server v0.7.2-eksbuild.3
- oauth2-proxy v7.9.0
- prometheus-pushgateway v1.11.1
- secrets-store-csi-driver-provider-aws v1.0.1
- velero v1.16.0
- vertical-pod-autoscaler v1.3.1
Actions to take
Grafana Prometheus datasource UID change
Due to an update how we provision Grafana datasources, it is possible that you will see error messages on your custom dashboards regarding the datasource not being found. If that is the case, you were most likely referencing the Prometheus datasource by UID. To fix this, make sure to change the datasource reference by name: Prometheus. In the json model of a dashboard, you can do this by replacing all instances of:
{
  "datasource": {
    "type": "prometheus",
    "uid": "A-LONG-STRING"
  }
}
with:
{
  "datasource": {
    "type": "prometheus",
    "name": "Prometheus"
  }
}
Grafana AngularJS deprecation (final call)
This is the last version of Grafana 11 we will deploy, planning to upgrade to Grafana 12 next month. As previously communicated, support for dashboardss using AngularJS based plugins will be removed in Grafana 12. As a result you can see warning messages in Grafana dashboards, helping you to identify which panels are using AngularJS plugins.
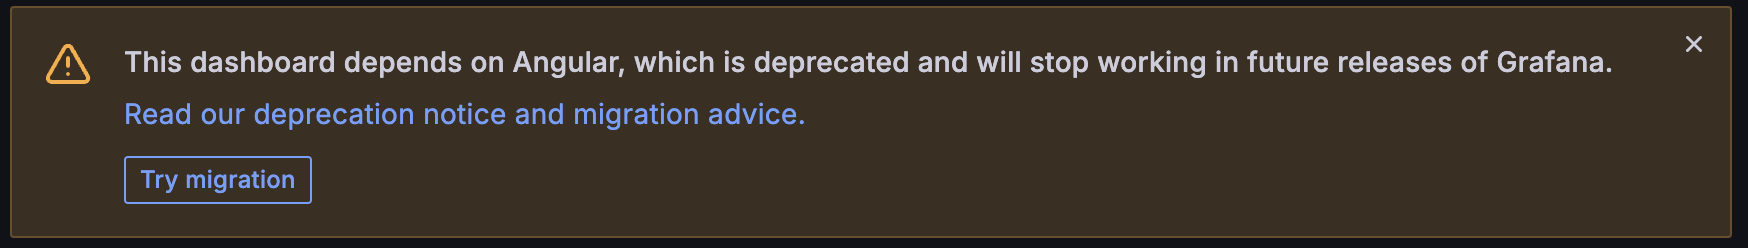
Many of our customers deploy their own custom dashboards, so we recommend you to check these for AngularJS plugin warnings and update them accordingly. For more information on how to do this, you can refer to the Grafana pages on this topic:
- Removal of AngularJS support in Grafana: what you need to know (blog)
- List of lugins using AngularJS and alternatives to use
Often, you can just click the Try migration button in the warning and Grafana will auto-migrate your dashboard. After verifying the results, you can save your updated dashboard:
- If using persistence, just click save and you’re done
- If not using persistence, instead relying on dynamic ConfigMap dashboard loading, export the dashboard’s json and backport it to your ConfigMap.
The most commonly used core plugins to change are Graph (old), Singlestat, Table (old), and Worldmap. While these can be auto-migrated, you can also update them to the newer versions, for example:
graph->timeseriessinglestat->stat
Some old custom plugins also have found there way as core plugins. For example you can replace grafana-piechart-panel with the build-in Pie Chart.
[!NOTE] While we have updated our own custom dashboards to use newer plugin versions, unfortunately there are a handfull of leftover dashboards, included in the upstream
kube-prometheus-stackthat we deploy and have not yet been updated. You can safely ignore the warnings for these dashboards for now. Affected dashboards are:
- Alertmanager / Overview
- Grafana / Overview