
Update 2024-08-20: These changes have been rolled out to all clusters.
As part of our regular upgrade cycle, the following Kubernetes cluster components have been updated and have been rolled out to all our managed clusters. The following updates have been rolled out to non-production clusters, and will be pushed to production in the coming week. This is also a reminder to for Actions to take regarding the Grafana AngularJS deprecation!
Most other updates focus on resolving CVEs, bug fixes and general improvements. Click each link to go to the full upstream changelog.
- amazon-eks-ami v20240807
- aws-ebs-csi-driver v1.33.0-eksbuild.1
- aws-efs-csi-driver v2.0.7
- aws-vpc-cni v1.18.3-eksbuild.1
- cert-manager v1.15.2
- dex v2.41.1
- fluent-bit v3.1.4
- grafana-agent v0.42.0
- ingress-nginx v1.11.1
- keda v2.15.0
- kube-prometheus-stack chart v61.8.0
- This brings updates to alertmanager, prometheus-operator, prometheus, grafana, etc.
- prometheus v2.54.0
- prometheus-operator v0.75.2
- loki v3.1.1
- nvidia-k8s-device-plugin v0.16.2
- vertical-pod-autoscaler v1.2.0
Actions to take
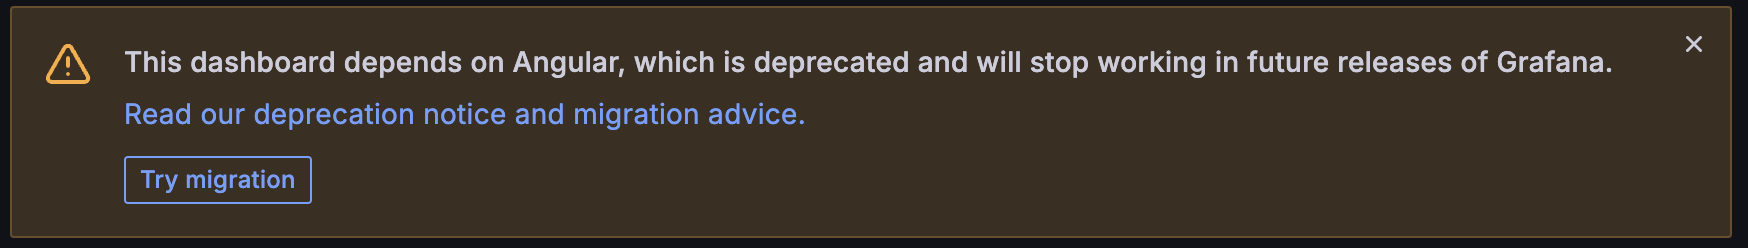
An important change has come to Grafana where the use of AngularJS is being removed in favor of React. Support for AngularJS will be completely removed in Grafana 12, the next major release. As a result you will see warning messages in Grafana dashboards, helping you to identify which panels are using AngularJS plugins.
Many of our customers deploy their own custom dashboards, so we recommend you to check these for AngularJS plugin warnings and update them accordingly. For more information on how to do this, you can refer to the Grafana pages on this topic:
- Removal of AngularJS support in Grafana: what you need to know (blog)
- List of lugins using AngularJS and alternatives to use
Often, you can just click the Try migration button in the warning and Grafana will auto-migrate your dashboard. After verifying the results, you can save your updated dashboard:
- If using persistence, just click save and you’re done
- If not using persistence, instead relying on dynamic ConfigMap dashboard loading, export the dashboard’s json and backport it to your ConfigMap.
The most commonly used core plugins to change are Graph (old), Singlestat, Table (old), and Worldmap. While these can be auto-migrated, you can also update them to the newer versions, for example:
graph->timeseriessinglestat->stat
Some old custom plugins also have found there way as core plugins. For example you can replace grafana-piechart-panel with the build-in Pie Chart.
[!NOTE] While we have updated our own custom dashboards to use newer plugin versions, unfortunately there are a handfull of leftover dashboards, included in the upstream
kube-prometheus-stackthat we deploy and have not yet been updated. You can safely ignore the warnings for these dashboards for now. Affected dashboards are:
- Alertmanager / Overview
- Grafana / Overview
- Node Exporter / MacOS
- Node Exporter / Nodes
- Node Exporter / USE Method / Cluster
- Node Exporter / USE Method / Node
- Prometheus / Overview